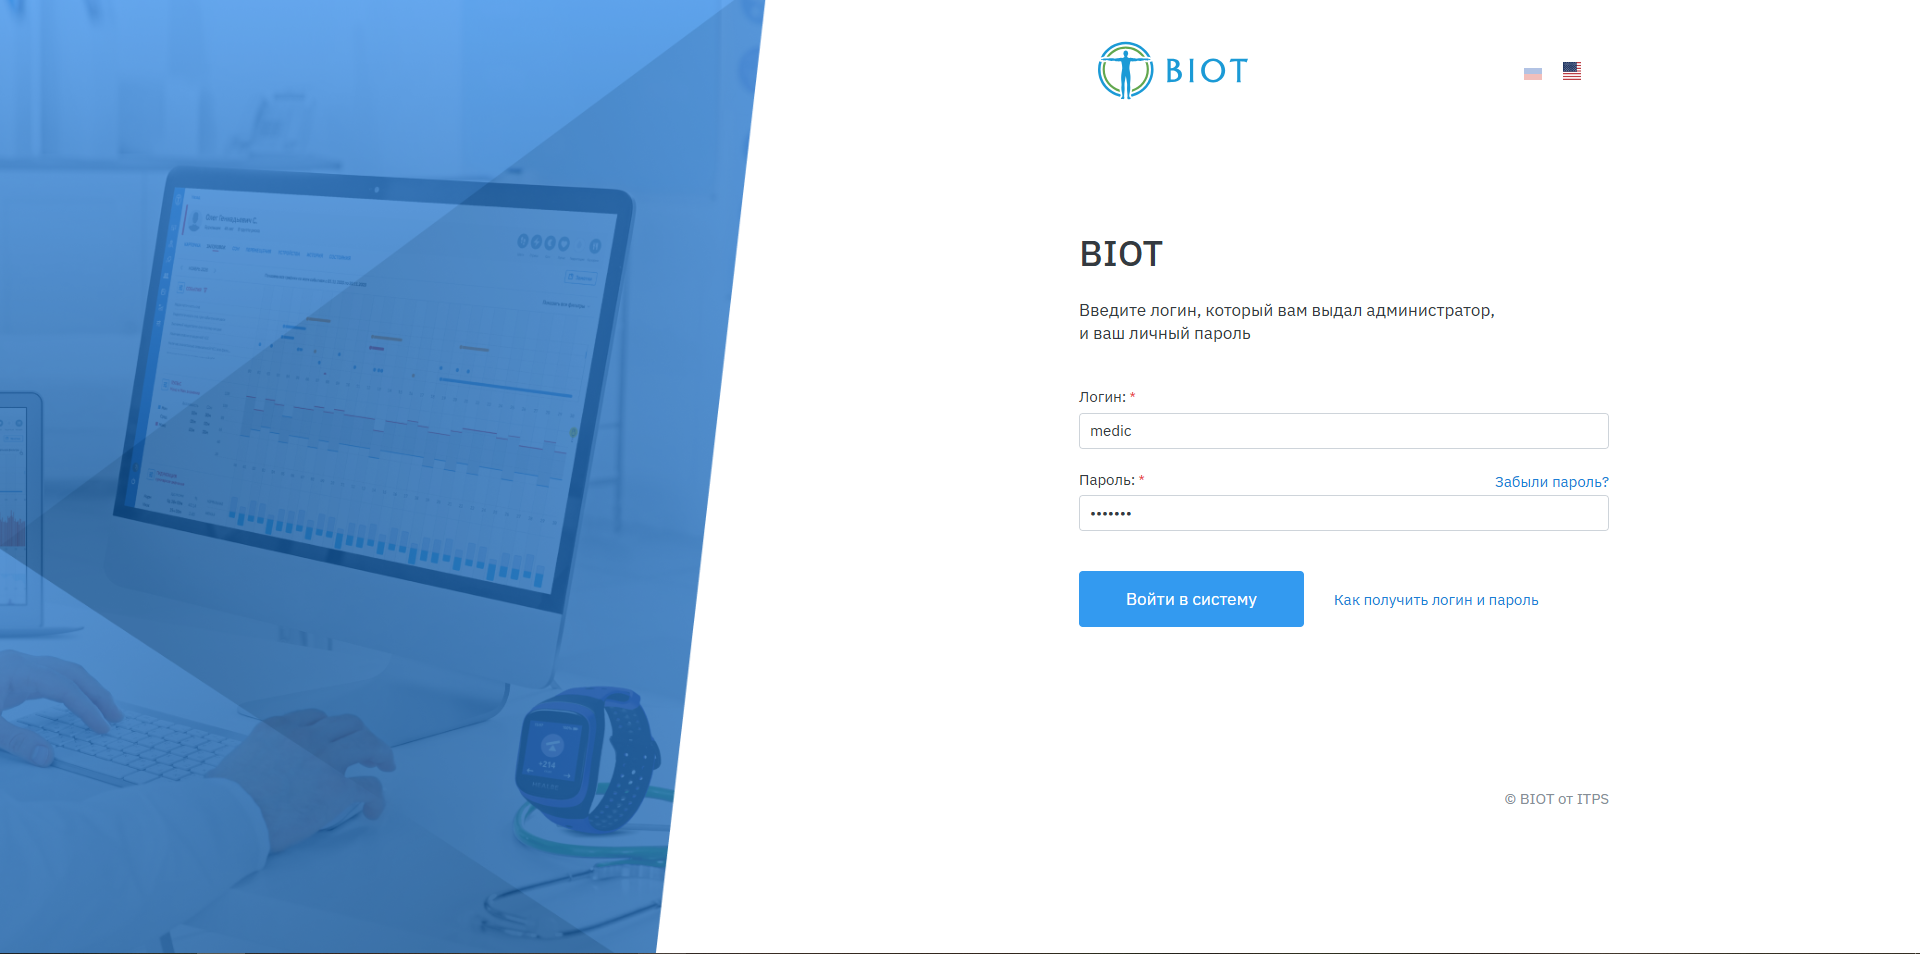
Log in to BIOT
In your browser (the latest version of Google Chrome, Microsoft Edge, Safari, Mozilla Firefox, Opera, or Yandex Browser is recommended), open https://biot.itps.com/ and log in with your personal credentials.

A detailed guide for physicians: monitoring employee health status, analyzing wearable-device metrics, assessing health risks, and working with the at-risk group.
Get started →How to connect to the system, register, log in, and log out.
You need an Internet connection. For the BIOT interface to display correctly, use the latest version of Mozilla Firefox, Google Chrome, Microsoft Edge or Safari on a desktop computer, or Google Chrome or Safari on an Android or iOS tablet.
To launch the system, open your browser and enter this address: https://biot.itps.com
Users are registered by the system administrator. After registration, an email with a link is automatically sent to the user. The link expires after 24 hours.
Click the link in the email. A page for entering and confirming your password will open in your browser.
Enter a password of 8 characters containing uppercase and lowercase Latin letters, numbers, and special characters. Click Create password.
After you create the password, the login page opens. Enter your username and password and click Log in.
To change or recover your password, click Forgot password? on the login page and follow the on-screen instructions.
BIOT login screen
⚠ Note: If your username and/or password don’t match, your account is locked, or you don’t have access, the system will display an error message. Contact your system administrator to resolve the issue.
You can have multiple browser tabs open while working in the system. To log out, use the Log out function on any open page. The button is in the lower-left corner of the screen..
The information, sections, and functions available to you depend on the permissions you have been granted.

System navigation: four interface zones
The menu panel on the left side of the page lists the system’s main sections.
Navigation among the blocks of the selected section is at the top of the page.
The main content of the selected menu item opens here.
Data in the section is selected and filtered using the panel on the right.
| SECTION | DESCRIPTION |
|---|---|
| Current Conditions | Conditions of monitored individuals with abnormalities detected in any metric today |
| Conditions | History of conditions detected by the system based on established rules, criteria, and norms |
| Monitored Individuals | Master list of people under observation, with a link to detailed information on each |
| User Profile | Language, time zone, and notification settings for the system user |
| Settings | Core system settings: user management, monitored individuals, devices |
This tool lets you track the conditions detected today for all monitored individuals across various metrics, sorted by how far they deviate from the norm and by when the condition began.
Shows only people who have had deviations from the norms set by the physician during the current day.
Shows everyone in the at-risk group, whether or not they have any open conditions today.
The severity level of a condition is defined for each model. The system detects deviations using algorithms specific to each model. The physician sets the norms for each model and for each individual.
All profile cards are sorted by the severity of the deviation and the time the condition began, from most to least significant, and are color-coded accordingly. People with the most recently detected conditions move to the top of the list.
Slight deviations from the norm
Require a specialist’s attention
Respond as a priority

An individual’s composite condition. Metric icons highlighted in bright color show which metrics were used to detect the deviations.
💡 For a detailed analysis of an individual’s detected conditions, click the person’s photo or name to open a page listing their conditions.
Different types of conditions are recorded automatically based on data from personal wearable devices. The system processes incoming data on individuals’ physical condition and activity and checks it against the established norms.
| FIELD | DESCRIPTION |
|---|---|
| Condition level | Minor / moderate / significant deviations, indicated by color |
| Created | When the system detected the condition |
| Model code | Short designation of the condition model |
| Condition | Name of the condition model |
| Monitored individual | Full name of the person in whom the condition was detected |
| Start | Date and time the condition started |
| End | Date and time the condition ended |
| Duration | How long the individual was in the condition |
💡 To view details about a condition, click its row. A page with detailed information will open.
To view the list of people under observation, click Monitored Individuals in the menu. The list shows only the people you have permission to access.
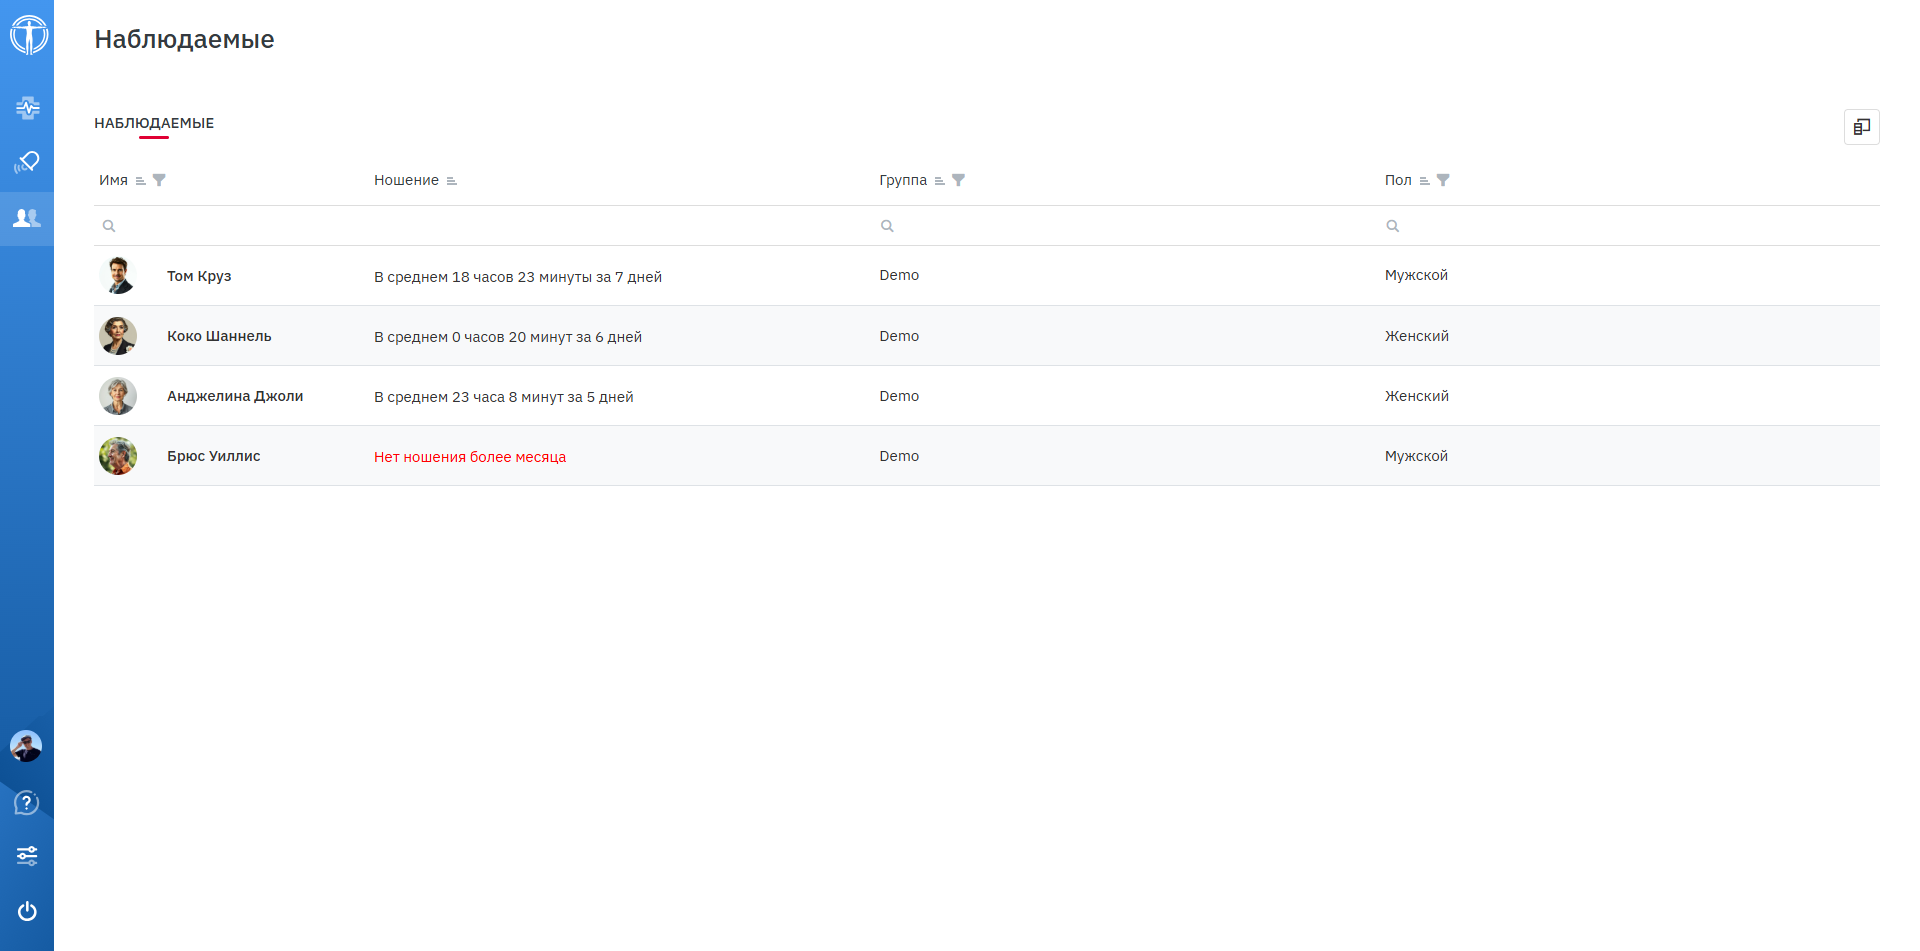
Monitored individuals
If there are many records, use the page controls below the list to move between pages.
To search, start typing a name in the search field of the Full Name column. The list filters automatically as you type. Search works together with any other filters you’ve set and is available in all other columns.
Click the filter icon in the relevant column, check the boxes next to the values you want, and click OK at the bottom of the filter panel.
To view and analyze an individual’s data, click their name in the list to open their details.
The sections available to you depend on the permissions of the logged-in user. Key information about the individual appears at the top of every tab: general details, overall condition, the metrics in which conditions were detected, and the date of the last data sync from the wearable device (the link opens the Data View page for that date).
The profile card contains key information about the individual.
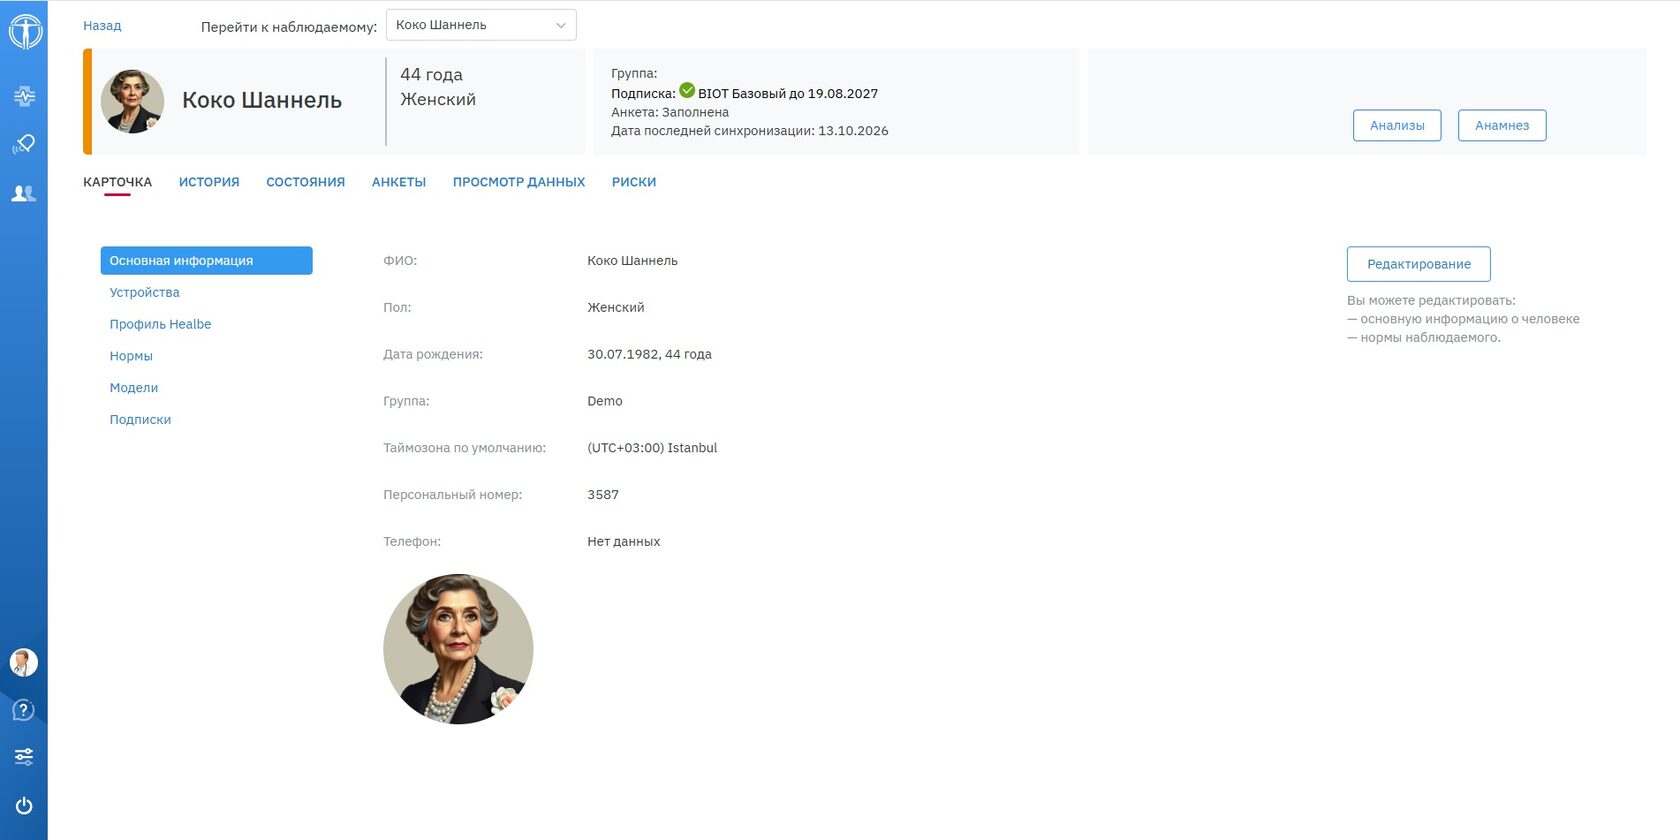
Individual’s Profile Card
👥 At-risk group People who need extra attention from the physician. The physician decides who is added to the at-risk group. To do so, open the Norms tab on the profile card and check Member of at-risk group. The person’s at-risk status will then appear on the Current Conditions page and next to their name at the top of their page.
To view and analyze an employee’s accumulated historical data, open the History tab on their profile card.
Long-term trends are shown as charts and as percentage breakdowns of the levels of various metrics. The page provides aggregated data for each metric over the selected period.

Monitored individual’s metric history
This log is a registry of every condition ever recorded for the individual, at every severity level.
It differs from the overall conditions log for all monitored individuals (Section 4) in that its table has the following columns:

Monitored individual’s condition log
In addition to wristband data, BIOT analyzes data from questionnaires that monitored individuals complete. This data improves the accuracy of risk-level assessments.
You can review the answers yourself, draw conclusions, and leave comments.

Monitored individual’s questionnaire list
💡 An individual can complete a questionnaire more than once during the monitoring period if needed to get current data.
Data View lets you monitor an individual’s condition by day, week, month, or quarter, with metric charts and summary statistics.
You can see the set of charts your permissions allow. For each metric, the page shows:

Monitored individual’s conditions, heart rate, and activities for the day

An individual’s hydration and stress for a day
⚠ If the individual has no personal device collecting the necessary data, the device hasn’t synced, or the person didn’t wear it on the selected day, the charts and metrics on the page will be empty.
By default, the page shows data for the current day, in the individual’s time zone, with the metrics your permissions allow.
To view metrics for earlier days or other periods, select a period and date. Week, month, and quarter are calendar periods and can’t be set to custom ranges.
This page shows numerical risk scores for several types of risk for the individual, based on wearable-device data and questionnaire data.
Charts of the risks BIOT can assess, their history, and BMI and blood pressure figures.
A text description of current risk levels and personalized recommendations, both for the patient and as prompts for the physician. Switch between them at the top of the page.

Individual’s risk assessment
On this page, the user can view and change their account settings.

User profile
The Settings section is for managing the system’s core components. When you open it, choose the section you want to view or change.
This duplicates Section 5 and lets you create profiles for new monitored individuals. It also adds the ability to add monitored individuals.
A step-by-step guide to adding Healbe users as monitored individuals so you can track their health metrics and work with their data in BIOT.
In your browser (the latest version of Google Chrome, Microsoft Edge, Safari, Mozilla Firefox, Opera, or Yandex Browser is recommended), open https://biot.itps.com/ and log in with your personal credentials.
Заполните необходимые поля:
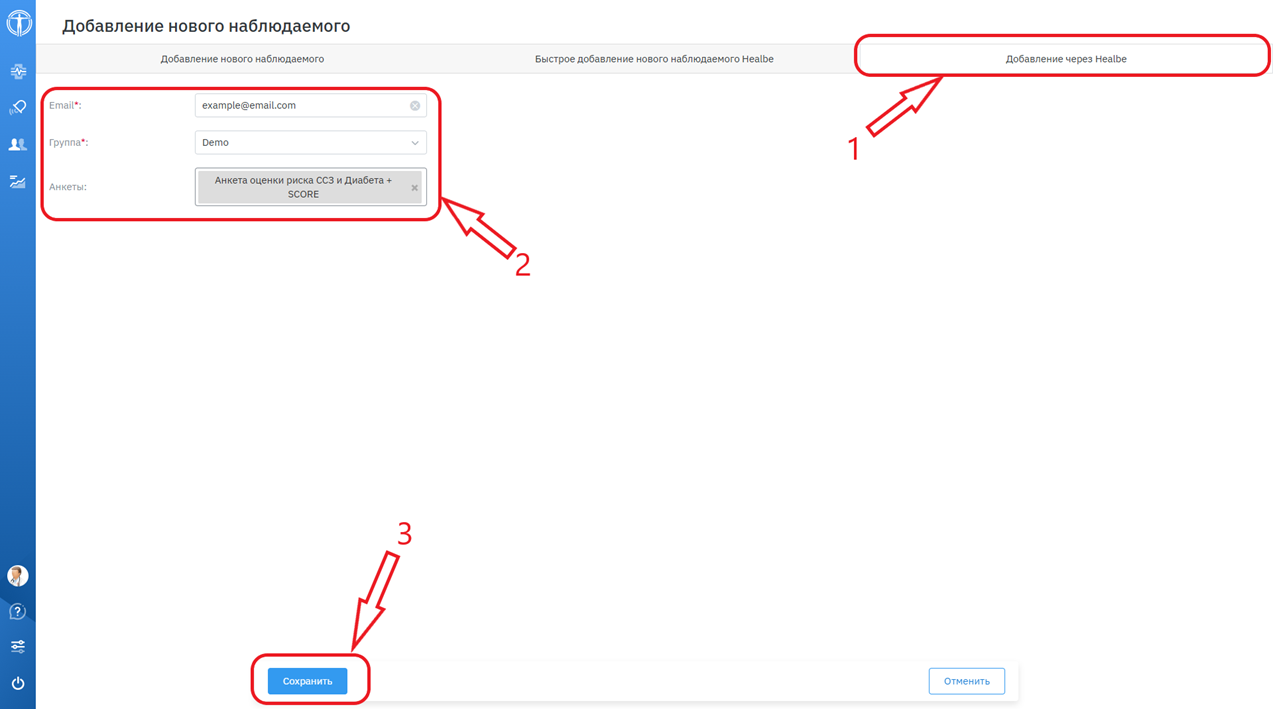
Клиенту необходимо открыть направленное письмо и нажать на кнопку «Открыть доступ».
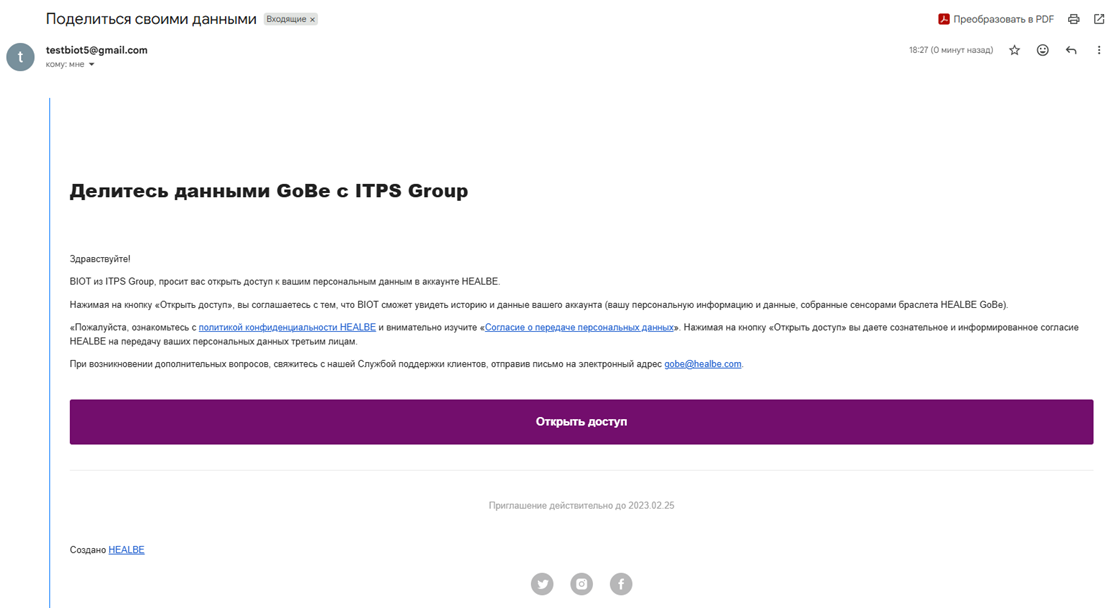
Через некоторое время клиент появится у вас в списке наблюдаемых.